


When you have a chronic illness, progress is often slow. I have frequently been frustrated by setbacks, but I have held on to the hope I get from the fact that 40% of ME/CFS patients make “substantial improvements” from their initial infection. I have also kept meticulous data on my symptoms every single day for the past two years, starting in July 2023.
As a huge music lover, I have always enjoyed the end-of-year roundup I get via Spotify Wrapped, and I have been waiting for the day I had two years’ worth of Long COVID/ME/CFS symptoms to compare. My silly video has the basics, but here is some more detailed data for any curious nerds like me :)
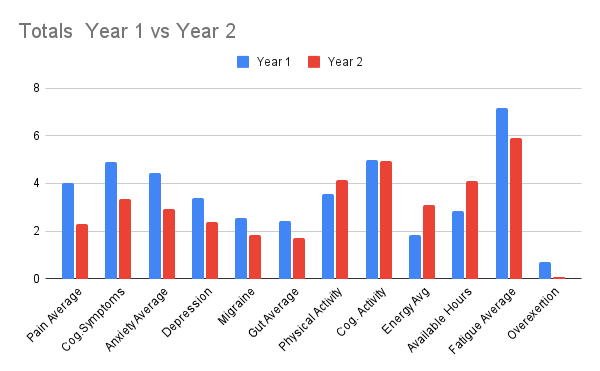
Totals Year 1 vs. Year 2
Fatigue Year 1 vs. Year 2 by Month (low is good!)

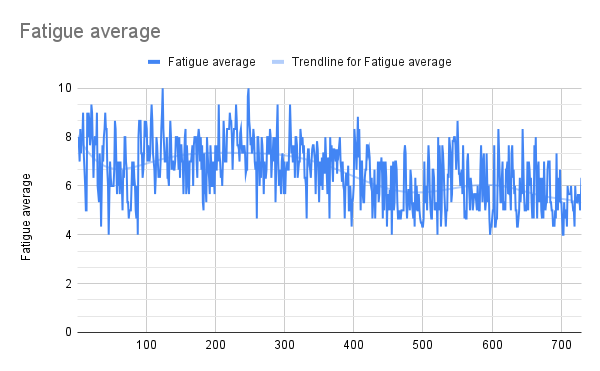
Fatigue since 2023 (as you can see, progress is nonlinear.)
Brain Fog and Fatigue (see how they are correlated!?)

Physical Activity and Energy Level (also very correlated!)

Improvements by Percentage (as seen in video)

Fun Facts (as seen in video plus extras)
I had 65 migraines this year. That is almost exactly the same as last year’s 64
I spent 7,187 hours in bed this year. That is 210 less than last year.
I had 4 spoons per day this year. Last year, you averaged less than 3.
My fatigue improved by 17%.
I went from too fatigued to stand up to up and about most days!
As you see, I’ve made some significant improvements! I’m really happy with how far I have come and so glad I have kept such careful track of my data. For more, see my essay on my Fatigue Log and the article Mariana and I wrote about How to Track Your Symptoms. Thanks for following along!

Share this post